JUST HOW PROFITABLE IS YOUR STORE?
We recently released a brand new complimentary feature that we're very excited about - our Profitability Dashboard. This dashboard allows you the ability to view the overall profitability of your Amazon store with break downs to view your data by store, brand, category and ASIN. Set yearly goals including organic revenue, ad revenue and total revenue, plus ad spend & total costs. Compare actual profits against your goals and see a quick snapshot of your total revenue, total costs & total profit, all in one easy to read seller analytics dashboard! 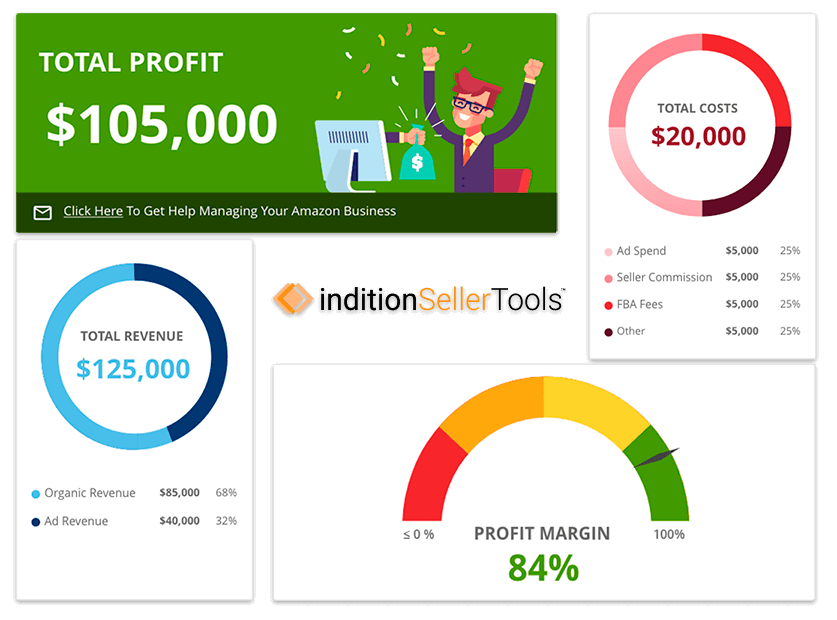
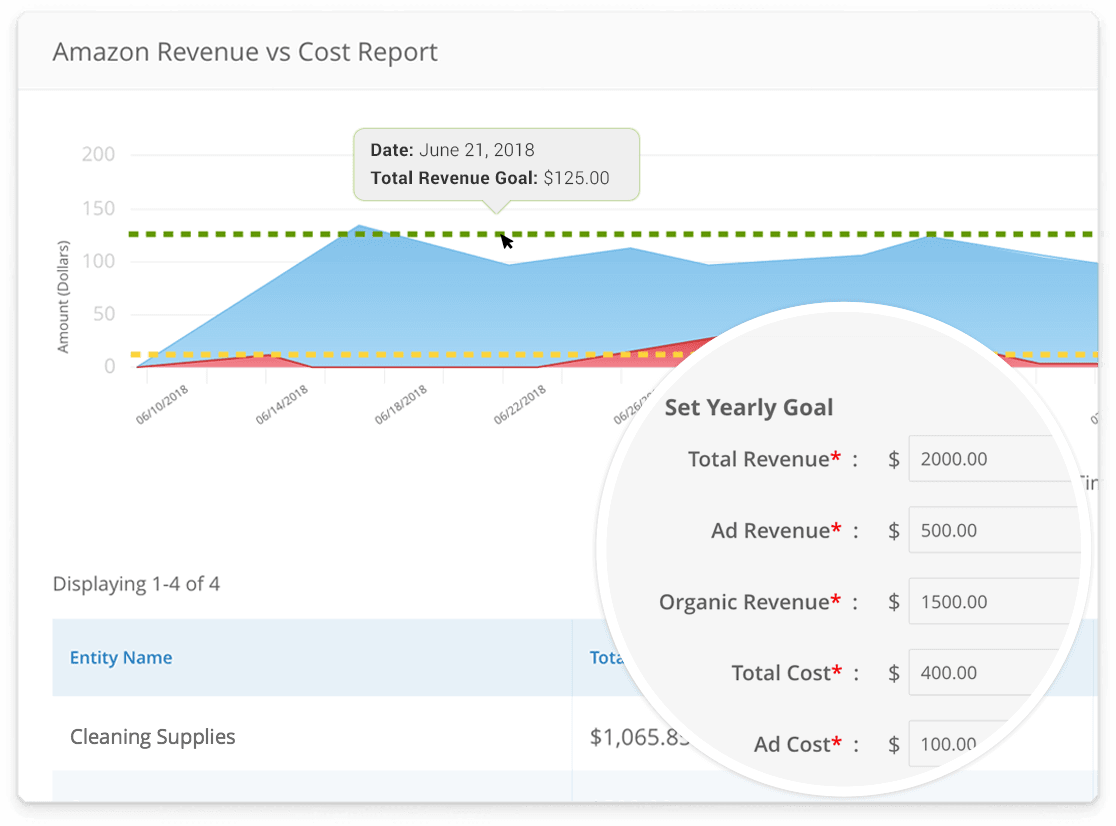
Yearly Goal Tracking
Set yearly goals for organic revenue, ad revenue, total revenue, ad costs and total costs. Our profitability dashboard will calculate monthly goals and provide a graph displaying actual Amazon revenue vs. goal revenue so you can easily keep track of how close you are to reaching or exceeding your goals.
Profitability Down to ASIN Level
We know how important profitaility is to Amazon businesses and how important it is to not only track overall store profitability but also the profit of individual products. Our profitability dashboard not only shows your overall store profitablity but allows you to also filter down to view profitability by brand, product category and even down to the individual ASIN level allowing yout to detemine which ASINs are the most profitable.
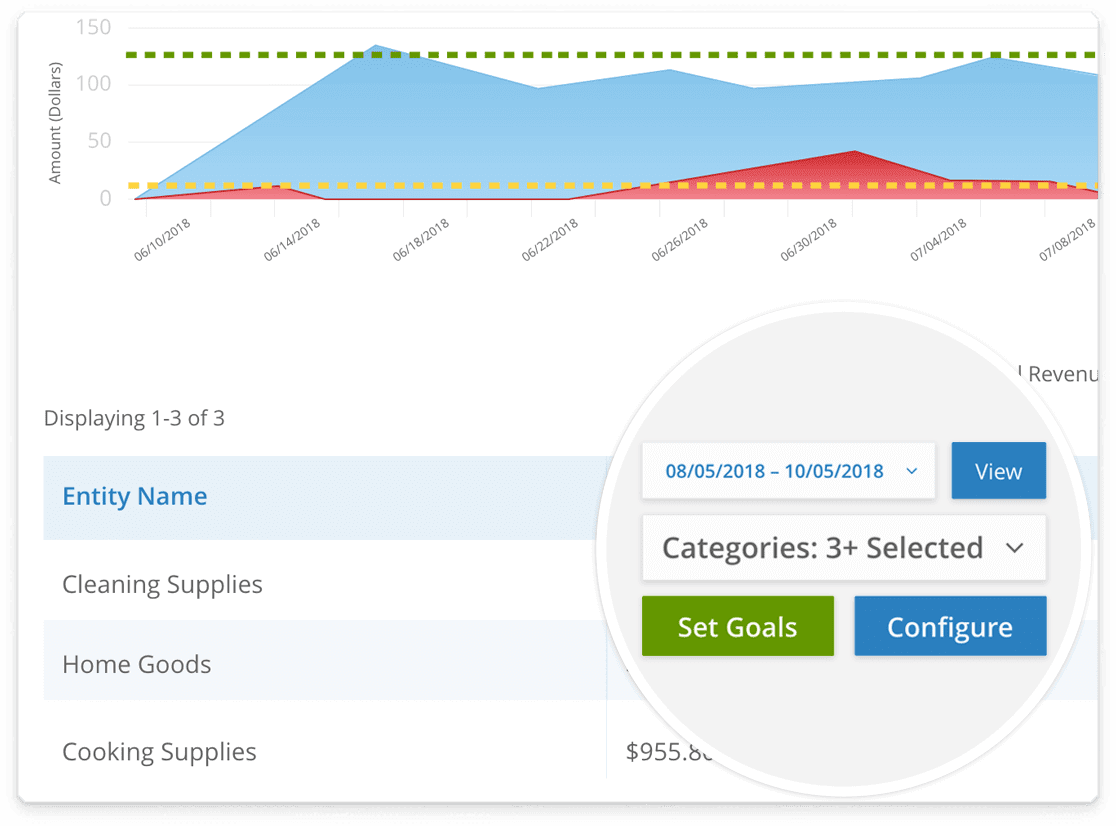
Configurable Profitability Graph
Our profitabilty dashboard comes complete with a graph that you can configure to the specific metrics you want to compare against your set goals. Do you want to see your actual organic revenue vs. your organic revenue goal? Or maybe you want to view your ad spend against ad revenue? You can choose which Amazon Seller metrics you want displayed on your graph and we'll do the calculations for you!